A candlestick chart is a type of financial chart that shows the open, high, low, and close prices of a security over a specified period of time
Reading a candlestick chart is an essential skill for traders and investors in the financial markets. Candlestick charts provide valuable information about the price movements of an asset, such as stocks, currencies, or commodities, over a specific period. Each candlestick represents the price action during that time frame.
Here are the basic
components of a candlestick chart:
Open: The price at which a security first trades during a given period.
High: The highest price that a security trades during a given period.
Low: The lowest price that a security trades during a given period.
Close: The price at which a security last trades during a given period.
Body: The main part of the candlestick, which represents the range between the open and close prices.
Wicks: The vertical lines that extend from the body, which represent the high and low prices for the period.
In Figure :-
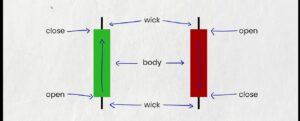
- The color of the candlestick body indicates whether the price closed higher or lower than it opened. If the body is filled in, the price closed lower than it opened. If the body is hollow, the price closed higher than it opened.
- The wicks of a candlestick can provide additional information about the trading activity during the period. A long wick indicates that there was a lot of volatility in the price, while a short wick indicates that the price was relatively stable.
- Candlestick charts can be used to identify different patterns that can help traders make informed decisions about when to buy or sell a security.
Here's a step-by-step guide on
how to read a candlestick chart:
1. Understanding Candlestick Components:-
A single candlestick on the chart consists of three main components:
(A) Body: The thick part of the candlestick represents the price range between the opening and closing prices during the given time period. If the closing price is higher than the opening price, the body is typically green or white, indicating a bullish (positive) trend. If the closing price is lower than the opening price, the body is red or black, indicating a bearish (negative) trend.
(B) Wick or Shadow: The thin lines extending from the top and bottom of the body are called wicks or shadows. They represent the highest and lowest prices reached during the time period.
(C) Candlestick Time Frame: The time frame of each candlestick depends on the chart’s settings, such as 1 minute, 1 hour, 1 day, etc.
2. Interpreting Bullish and Bearish Candlesticks:-
Bullish candlesticks (green/white) indicate that the closing price is higher than the opening price, suggesting buying pressure and a potential uptrend. Conversely, bearish candlesticks (red/black) indicate that the closing price is lower than the opening price, suggesting selling pressure and a potential downtrend.
3. Identifying Candlestick Patterns:-
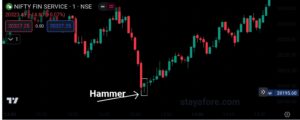
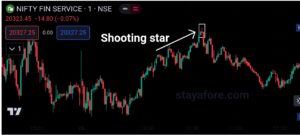
Candlestick patterns are specific formations made by multiple candlesticks. They can provide valuable insights into potential price reversals or continuations. Some common patterns include doji, hammer, shooting star, engulfing patterns, and more. It’s essential to study and understand these patterns to make informed trading decisions.
4. Analyzing Candlestick Charts with Technical Indicators:-
Candlestick charts are often used in conjunction with technical indicators like moving averages, RSI (Relative Strength Index), MACD (Moving Average Convergence Divergence), etc. These indicators can provide additional confirmation of potential trends or reversals.
5. Paying Attention to Time Frames:
Different time frames on the chart offer varying levels of detail. Shorter time frames, like 1-minute or 5-minute charts, show more granular price movements and are suitable for day traders. Longer time frames, like daily or weekly charts, provide a broader view of the asset’s performance and are suitable for long-term investors.
6. Practice and Experience:-
Reading candlestick charts requires practice and experience. Start by observing historical charts and identifying patterns and trends. As you gain familiarity, try making some mock trades based on your analysis to see how well you can predict price movements.
Some common candlestick patterns include:
- Hammer:- A bullish candlestick pattern that indicates a potential bottom.
- Shooting star: A bearish candlestick pattern that indicates a potential top.
- Doji: A neutral candlestick pattern that indicates indecision in the market.
doji
Candlestick charts can be a powerful tool for technical analysis, but it is important to remember that they are not foolproof. There is no guarantee that a candlestick pattern will always lead to a profitable trade. However, by understanding the basics of candlestick charts, you can gain a better understanding of the market and make more informed trading decisions.
Here are some additional tips for reading candlestick charts:
- Use multiple timeframes.Don’t just look at the daily chart. Look at the hourly, 15-minute, and even 5-minute charts to get a better understanding of the overall trend.
- Pay attention to volume.Volume is the number of shares that were traded during a given period. High volume can indicate that a trend is strong, while low volume can indicate that a trend is losing momentum.
- Use candlestick patterns in conjunction with other technical indicators. Candlestick patterns can be a useful tool, but they should not be used in isolation. Use them in conjunction with other technical indicators, such as moving averages and oscillators, to get a more complete picture of the market.
With a little practice, you can learn to read candlestick charts and use them to make more informed trading decisions.
Conclusion:-
Reading candlestick charts is a valuable skill for anyone involved in trading or investing. By understanding the components, interpreting bullish and bearish signals, identifying candlestick patterns, using technical indicators, and considering various time frames, you can make more informed decisions and navigate the financial markets with greater confidence. Remember that continuous learning and real-world practice are key to mastering the art of reading candlestick charts.