Investing in the stock market involves inherent risks and the potential for loss. Past performance is not indicative of future results. The information provided here is for informational purposes only and should not be considered investment advice. Always consult with a qualified financial advisor before making any investment decisions.
Candlestick Basic
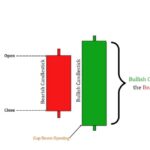
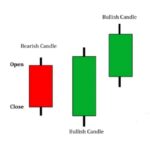
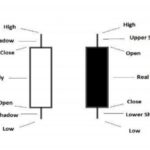 Just like a bar chart, a daily candlestick shows the market’s open,high, low, and close price for the day. The candlestick has a wide part,which is called the “real body.” This real body represents the price range between the open and close of that day’s trading.
Note :- “Black – Red, White – Green”
For example, if we look at the 15 minute candlestick chart, it shows the open, close, high, and low of that particular 15 minute candlestick chart.Mostly red and green colors represent candlesticks, in which red represents the falling price, and the green represents the rising price. See the picture below to understand it clearly.
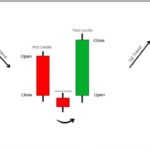
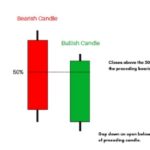
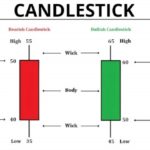 Look carefully at the above picture, two candlesticks are shown in it,Bearish and Bullish.If you look at the Bearish candlestick, it opened at 50 , later made a High of 55 and fell down, then closed at 40 with a Low of 35 . And if you look at the bullish candlestick, it is a bit opposite, in this the candlestick opened at 50 from the bottom, later made a low of 45 and went up and made a high of 65 and closed at 60 .
Types of candlestick patterns
-
Bullish Candlestick Patterns
Bullish Candlestick patterns are those that indicate up trending market. These candles
are primarily shown in green color. These candles also work as reversal candles. That’s
why we can also call them bullish reversal patterns. If these candles are formed in an
ongoing downtrend, the trend will change from down to up. So traders should be cautious
about their selling positions when a bullish reversal pattern appears. -
Bearish Candlestick Patterns
Bearish Candlestick patterns are those that indicate down trending market. These
candles are primarily shown in red color. These candles also work as a reversal. That’s
why we can call them bearish reversal patterns.
If these candles are formed in an ongoing uptrend, the trend will change from down to
up. - Continuation Candlestick Patterns ;
Continuation candlestick patterns continue the ongoing trend. for example, if an uptrend
is going on and these candlestick patterns appear, they will continue the uptrend.
1. Hammer
A hammer is a type of bullish reversal candlestick pattern, made up of just one candle,found in price charts of financial assets. The candle looks like a hammer, as it has a long lower vwick and a short body at the top of the candlestick with little or no upper wick.
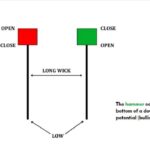 The psychology behind hammer formation is that after open price, sellers try to push the price down, but suddenly buyers come into the market and push the price up, which shows that buyers are more powerful than sellers.
2.Inverted Hammer
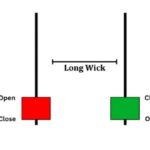
The inverted hammer is a type of candlestick pattern found after downtrend and is usually taken to be a trend-reversal signal. The inverted hammer looks like an upside down version of the hammer candlestick pattern, and when it appears in an uptrend is calleda shooting star.
 The psychology behind the inverted hammer formation is that buyers try to push the price up after the open price, but sellers come and push the price down again. Still, it was unsuccessful as they could not close the price below the opening price, which shows the sellers are getting weak in the market and indicates a reversal in an ongoing downtrend.
3. Shooting Star
In technical analysis, a shooting star is interpreted as a type of reversal pattern presaging a falling price. The Shooting Star looks exactly the same as the Inverted hammer, but instead of being found in a downtrend it is found in an uptrend and thus has different implications.
 implications.This candle mainly forms at the top of an uptrend and shows that bulls are getting weaker and unable to close the price higMan.
4. Hanging Man
A hanging man is a type of bearish reversal patterm, made up of just one candle, found in an uptrend of price charts of financial assets. It has a long lower wick and a short body at the top of the candlestick with little or no upper wick.
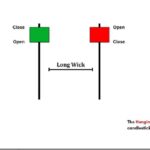 The psychology behind the hanging man candlestick formation is that after the opening price, sellers try to push the price down, but buyers come and push the price up again. Still, it was unsuccessful, as they could not close the price above the opening price. And this shows the buyers are getting weak in the market and indicates a reversal in the ongoing uptrend.
5. Dragonfly Doji
The doji is a commonly found pattern in a candlestick chart of financially traded assets in technical analysis. It is characterized by being small in length meaning a small trading range-with an opening and closing price that are virtually equal.
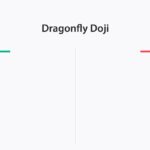
Shape: Looks like a “T” with a long lower shadow and a tiny body at the top.Formation: Open, high, and close prices are nearly the same, making a very short or nonexistent body.Significance: Indicates sellers tried to push the price down (long shadow), but buyers rallied by the end of the period, pushing the price back up to the opening level.
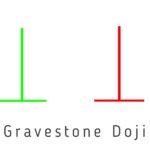
6.Gravestone Doji;
Gravestone doji is a bearish reversal candlestick pattern that is formed when the open, low, and closing prices are all near each other with a long upper shadow.
 7.Spinning Top;
A spinning top is a candlestick pattern with a short real body that’s vertically centered between long upper and lower shadows.
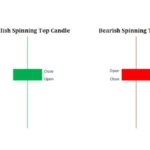 The spinning top is also like Doji. It indicates indecision among traders. The spinning top candlestick pattern is a little different than normal Doji. It has a little body, and Doji doesn’t have a body.
8. Bullish Engulfing
A bullish engulfing pattern is a candlestick pattern that forms when a small black candlestick is followed the next day by a large white candlestick, the body of which completely overlaps or engulfs the body of the previous day’s candlestick
 Mostly bullish engulfing candlestick patterns don’t have wicks, but sometimes a little wick is okay. No wick or little wick indicates the power of the bulls. The bigger the green candle, the healthier it is. Bullish engulfing candles work smoothly in a downtrend. On this candle, traders can enter for buying position.
9. Bullish Harami
A bullish harami is candlestick chart indicator used for spotting reversals in a bear trend.
 This pattern consists of two candlesticks, The first candle is bearish, and another is a small bullish candle that opens and closes inside the bearish candle. The first red candle shows a continuation of the downtrend, and the second candle represents bulls returning in the market.
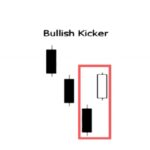
10.Bullish Kicker
A bullish kicker pattern indicates that the stock prices could be on the rise. Such an arrangemnent can be seen below: As shown, a bullish kicker pattern starts with a black (bearish) candlestick, which is then followed by a white (bullish) candlestick that opens above the black candlestick, creating a large upward gap.
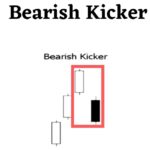
11. Bearish Kicker
The Bearish Kicker Candlestick Chart pattern’s reliability is high when it is formed at the
uptrend or formed in an overbought area
12.Morning Doji Star
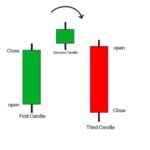
The Morning Doji Star candlestick formation is a three-day bullish reversal pattern. The Morning Doji Star candlestick pattern starts during a downtrend. The downtrend continues with a large-bodied candlestick. The second day opens lower, trades in a small range, then closes at its open forming a Doji.
 The psychology behind the morning doji star pattern is like this; the first candle shows the continuation of a downtrend. Then the second candle, the Doji candle, shows confusion between buyers and sellers, and the third candle shows that buyers are more powerful than sellers. The morning star pattern works in a downtrend. And it can reverse the ongoing downtrend to an uptrend.
13.Evening Doji Star: An Evening Doji Star consists of a long bullish candle, followed by a Doji that gaps up, then a third bearish candle that gaps down and closes well within the body of the first candle. An Evening Doji Star is a three candle bearish reversal pattern similar to the Evening Star.
 The psychology behind the evening star pattern is like this; The first candle shows the continuation of an uptrend. Then the second candle, the Doji candle, shows confusion between sellers and buyers, and the third candle shows that sellers are more powerful than buyers.
14. Three Inside Up Pattern
The three inside up pattern is a bullish reversal pattern composed of a large down candle,a smaller up candle contained within the prior candle, and then another up candle thatcloses above the close of the second candle.
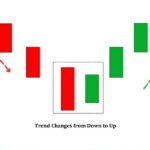 The three inside up candlestick pattern consists of three candlesticks. The first bearish candle indicates a continuation of the downtrend, and the second candle opens and closes inside the first bearish candle. These two candlesticks are like a bullish harami candlestick pattern. The third candle confirms the change in trend by closing above them. We can open buying positions after the completion of this pattern.
15. Three Inside Down Pattern
The three inside down pattern is a bearish reversal pattern composed of a large up candle, a smaller down candle contained within the prior candle, and then another down candle that closes below the close of the second candle.
 The three inside down candlestick pattern consists of three candlesticks. The first bullish candle indicates a Continuation of the uptrend, and the second candle opens and closes inside the first bullish candle. These two candlesticks are like a bearish harami candlestick pattern.The third candle confirms the change in trend by closing below them. We can open selling positions.
16. Three Outside Down
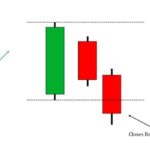
The three outside down, meanwhile, is a bearish candlestick pattern with the following characteristics: The market is in an uptrend. The first candle is white. The second candle is black with a long real body that fully contains the first candle. The third candle is black with a close lower than the second candle.
 The three outside down pattern consists of three candlesticks. The first candle is a short bullish candle. The second is a healthy bearish candlestick bigger than the And the last candlestick is also a healthy candlestick confirming the previous two candles by closing below them. Traders can take selling positions after the third candle confirmation when this pattern appears.ullish candle, which covers the first candle, so it’s like a bearish engulfing pattern.
17. Three Out side up
The three outside up is a bullish candlestick pattern with the following characteristics: The market is in a downtrend. The first candle is black. The second candle is white with a long real body and fully contains the first candle. The third candle is white with a higher close than the second candle.
The three-outside-up pattern consists of three candlesticks. The first candle is a short bearish candle. The second is a healthy bullish candlestick bigger than the bearish candle, which covers the first candle, so it’s like a bullish engulfing pattern.And the last candlestick is also a healthy bullish candlestick confirming the previous two candles by closing above them.nWhen this pattern appears, traders can take buying positions after the third candle’s confirmation.
18. Bullish Piercing Candlestick
A piercing pattern is a two-day, candlestick price pattern that marks a potential short term reversal from a downward trend to an upward trend. The pattern includes the first day opening near the high and closing near the low with an average or larger sized trading range.
The Piercing pattern consists of two candles. The first candle is bearish, representing a continuation of the downtrend, and the next candle opens the gap down. Still, it covers the first bearish candle by more than 50%, which shows that bears are getting weaker in the downtrend, buyers are back, and the trend is about to change.When this pattern forms in a downtrend, traders should be cautious about their seling positions or add new buying positions.
19.Bearish Dark Cloud Cover
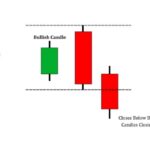
Dark Cloud Cover is a candlestick pattern that shows shift in momentum to the downside following a price rise. The pattern is composed of a bearish candle that opens above but then closes below the midpoint of the prior bullish candle.
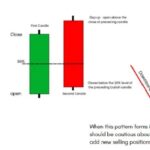
The Dark Cloud Cover pattern is made of two candles. The first candle is bullish, representing a continuation of the uptrend, and the next candle opens the gap up. Still, it covers the first bullish candle by more than 50%, which shows that bulls are getting weaker in the uptrend, sellers are back, and the trend is about to change.When this pattern forms in an uptrend, traders should be cautious about their buying positions or add new selling positions. We can also call this a bearish piercing pattern.
20. Three White Soldiers
The three white soldiers pattern is a bullish candlestick formation on a trading chart that occurs at the bottom of a downtrend.

This pattern consists of three candlesticks, which don’t have shadows or wicks. Three white soldiers patterns form when three bullish candles with no wicks are open below the previous candle’s closing and still close above the last candle’s high/closing. Three white soldiers indicate that bulls are back in the market.
IF YOU ARE WANT TO E BOOK THEN CLICK THIS IMAGE & LINK

THANKU LEARN AND SUCCED
This resource is incredible. The wonderful material exhibits the manager’s enthusiasm. I’m stunned and anticipate more such mind blowing posts.
This website is amazing. The excellent content demonstrates the creator’s passion. I’m in disbelief and hope to see more of this incredible content.
Thank you for reaching out! If you have any specific questions or topics in mind, please feel free to share them, and I’ll do my best to assist you. Whether you’re curious about a particular technology, scientific concept, literary work, or anything else, I’m here to provide information, advice, or engage in a discussion. Don’t hesitate to let me know how I can help you further!
It’s clear that you are passionate about making a positive impact and your blog is a testament to that Thank you for all that you do
certainly like your website but you need to take a look at the spelling on quite a few of your posts Many of them are rife with spelling problems and I find it very troublesome to inform the reality nevertheless I will definitely come back again.